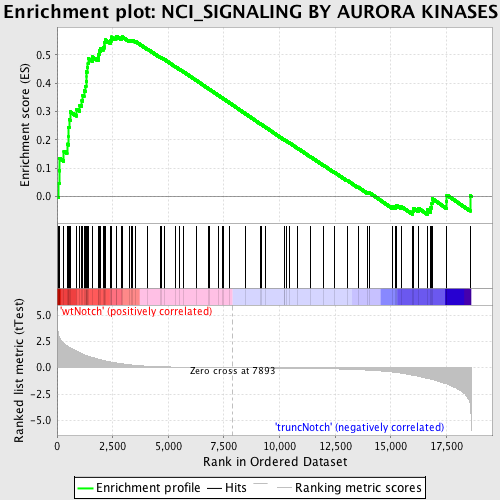
Profile of the Running ES Score & Positions of GeneSet Members on the Rank Ordered List
| Dataset | Set_03_truncNotch_versus_wtNotch.phenotype_truncNotch_versus_wtNotch.cls #wtNotch_versus_truncNotch.phenotype_truncNotch_versus_wtNotch.cls #wtNotch_versus_truncNotch_repos |
| Phenotype | phenotype_truncNotch_versus_wtNotch.cls#wtNotch_versus_truncNotch_repos |
| Upregulated in class | wtNotch |
| GeneSet | NCI_SIGNALING BY AURORA KINASES |
| Enrichment Score (ES) | 0.56593204 |
| Normalized Enrichment Score (NES) | 1.6256886 |
| Nominal p-value | 0.0031847134 |
| FDR q-value | 0.20624186 |
| FWER p-Value | 0.896 |
| PROBE | DESCRIPTION (from dataset) | GENE SYMBOL | GENE_TITLE | RANK IN GENE LIST | RANK METRIC SCORE | RUNNING ES | CORE ENRICHMENT | |
|---|---|---|---|---|---|---|---|---|
| 1 | NCAPH | 6220435 | 56 | 3.183 | 0.0471 | Yes | ||
| 2 | NDEL1 | 2370465 | 94 | 2.900 | 0.0908 | Yes | ||
| 3 | CHUK | 7050736 | 113 | 2.821 | 0.1342 | Yes | ||
| 4 | TPX2 | 6420324 | 306 | 2.306 | 0.1601 | Yes | ||
| 5 | CUL3 | 1850520 | 446 | 2.066 | 0.1852 | Yes | ||
| 6 | NSUN2 | 2120193 | 517 | 1.961 | 0.2123 | Yes | ||
| 7 | RASA1 | 1240315 | 523 | 1.945 | 0.2426 | Yes | ||
| 8 | UBE2D3 | 3190452 | 542 | 1.915 | 0.2718 | Yes | ||
| 9 | NCL | 2360463 4540279 | 591 | 1.866 | 0.2986 | Yes | ||
| 10 | NDC80 | 4120465 | 867 | 1.583 | 0.3087 | Yes | ||
| 11 | KIF23 | 5570112 | 1019 | 1.409 | 0.3227 | Yes | ||
| 12 | CDCA8 | 2340286 6980019 | 1114 | 1.320 | 0.3384 | Yes | ||
| 13 | CYLD | 6590079 | 1155 | 1.276 | 0.3563 | Yes | ||
| 14 | IKBKB | 6840072 | 1212 | 1.233 | 0.3727 | Yes | ||
| 15 | RIPK2 | 5050072 6290632 | 1265 | 1.187 | 0.3886 | Yes | ||
| 16 | MAPK14 | 5290731 | 1301 | 1.150 | 0.4048 | Yes | ||
| 17 | AURKA | 780537 | 1317 | 1.140 | 0.4220 | Yes | ||
| 18 | MAP3K14 | 5890435 | 1319 | 1.137 | 0.4398 | Yes | ||
| 19 | GSK3B | 5360348 | 1347 | 1.119 | 0.4560 | Yes | ||
| 20 | INCENP | 520593 | 1387 | 1.082 | 0.4709 | Yes | ||
| 21 | BCL3 | 3990440 | 1412 | 1.061 | 0.4863 | Yes | ||
| 22 | PPP2R5D | 4010156 380408 5550112 5670162 | 1582 | 0.982 | 0.4927 | Yes | ||
| 23 | TACC3 | 5130592 | 1848 | 0.814 | 0.4912 | Yes | ||
| 24 | CENPA | 5080154 | 1872 | 0.803 | 0.5026 | Yes | ||
| 25 | BIRC5 | 110408 580014 1770632 | 1894 | 0.790 | 0.5139 | Yes | ||
| 26 | BIRC2 | 2940435 4730020 | 1953 | 0.757 | 0.5227 | Yes | ||
| 27 | MALT1 | 4670292 | 2066 | 0.685 | 0.5274 | Yes | ||
| 28 | TRAF6 | 4810292 6200132 | 2133 | 0.654 | 0.5341 | Yes | ||
| 29 | TNF | 6650603 | 2136 | 0.652 | 0.5443 | Yes | ||
| 30 | STMN1 | 1990717 | 2167 | 0.636 | 0.5527 | Yes | ||
| 31 | SMC2 | 4810133 | 2389 | 0.548 | 0.5494 | Yes | ||
| 32 | CPEB1 | 3190524 | 2427 | 0.533 | 0.5558 | Yes | ||
| 33 | SMC4 | 5910240 | 2448 | 0.524 | 0.5630 | Yes | ||
| 34 | AURKB | 5890739 | 2647 | 0.458 | 0.5595 | Yes | ||
| 35 | BCL10 | 2360397 | 2661 | 0.455 | 0.5659 | Yes | ||
| 36 | MDM2 | 3450053 5080138 | 2893 | 0.375 | 0.5594 | No | ||
| 37 | EVI5 | 6380040 | 2920 | 0.367 | 0.5638 | No | ||
| 38 | REL | 360707 | 3244 | 0.279 | 0.5507 | No | ||
| 39 | NOD2 | 2510050 | 3324 | 0.261 | 0.5506 | No | ||
| 40 | PPP1CC | 6380300 2510647 | 3376 | 0.251 | 0.5518 | No | ||
| 41 | TNFRSF1A | 1090390 6520735 | 3542 | 0.215 | 0.5462 | No | ||
| 42 | RELA | 3830075 | 4082 | 0.138 | 0.5193 | No | ||
| 43 | PIK3CA | 6220129 | 4636 | 0.093 | 0.4909 | No | ||
| 44 | ATM | 3610110 4050524 | 4686 | 0.090 | 0.4897 | No | ||
| 45 | IKBKG | 3450092 3840377 6590592 | 4826 | 0.082 | 0.4835 | No | ||
| 46 | KLHL13 | 6590731 | 5319 | 0.059 | 0.4579 | No | ||
| 47 | TDRD7 | 6550520 | 5495 | 0.052 | 0.4493 | No | ||
| 48 | JUB | 5860711 5900500 | 5663 | 0.047 | 0.4410 | No | ||
| 49 | SRC | 580132 | 6242 | 0.031 | 0.4103 | No | ||
| 50 | RAN | 2260446 4590647 | 6789 | 0.019 | 0.3811 | No | ||
| 51 | KIF2C | 6940082 | 6866 | 0.018 | 0.3773 | No | ||
| 52 | AKT1 | 5290746 | 7250 | 0.010 | 0.3568 | No | ||
| 53 | PAK1 | 4540315 | 7429 | 0.008 | 0.3473 | No | ||
| 54 | FBXW11 | 6450632 | 7458 | 0.007 | 0.3459 | No | ||
| 55 | XPO1 | 540707 | 7753 | 0.002 | 0.3301 | No | ||
| 56 | BUB1 | 5390270 | 8457 | -0.009 | 0.2923 | No | ||
| 57 | NPM1 | 4730427 | 9124 | -0.020 | 0.2567 | No | ||
| 58 | PIK3R1 | 4730671 | 9205 | -0.022 | 0.2527 | No | ||
| 59 | CBX5 | 3830072 6290167 | 9360 | -0.024 | 0.2448 | No | ||
| 60 | SGOL1 | 1980075 5220092 6020711 | 10214 | -0.040 | 0.1994 | No | ||
| 61 | DES | 1450341 | 10230 | -0.041 | 0.1992 | No | ||
| 62 | SYK | 6940133 | 10320 | -0.042 | 0.1951 | No | ||
| 63 | PSMA3 | 5900047 7040161 | 10440 | -0.045 | 0.1894 | No | ||
| 64 | ARHGEF7 | 1690441 | 10801 | -0.054 | 0.1708 | No | ||
| 65 | AURKC | 4060687 | 11384 | -0.069 | 0.1405 | No | ||
| 66 | BRCA1 | 4780669 | 11972 | -0.090 | 0.1102 | No | ||
| 67 | ERC1 | 1580170 2630717 6110762 6840280 | 12462 | -0.111 | 0.0856 | No | ||
| 68 | MYLK | 4010600 7000364 | 13035 | -0.144 | 0.0570 | No | ||
| 69 | KIF20A | 2650050 | 13526 | -0.183 | 0.0334 | No | ||
| 70 | PRKCA | 6400551 | 13971 | -0.229 | 0.0131 | No | ||
| 71 | VIM | 20431 | 14039 | -0.235 | 0.0132 | No | ||
| 72 | TNFAIP3 | 2900142 | 15056 | -0.405 | -0.0353 | No | ||
| 73 | RACGAP1 | 3990162 6620736 | 15208 | -0.437 | -0.0366 | No | ||
| 74 | TP53 | 6130707 | 15236 | -0.442 | -0.0310 | No | ||
| 75 | GADD45A | 2900717 | 15472 | -0.512 | -0.0357 | No | ||
| 76 | PRKACA | 2640731 4050048 | 15991 | -0.708 | -0.0525 | No | ||
| 77 | OAZ1 | 110181 | 16022 | -0.724 | -0.0427 | No | ||
| 78 | NFKB1 | 5420358 | 16242 | -0.822 | -0.0416 | No | ||
| 79 | RHOA | 580142 5900131 5340450 | 16637 | -0.998 | -0.0471 | No | ||
| 80 | NFKB2 | 2320670 | 16799 | -1.069 | -0.0390 | No | ||
| 81 | LCK | 3360142 | 16840 | -1.087 | -0.0240 | No | ||
| 82 | NFKBIA | 1570152 | 16859 | -1.101 | -0.0076 | No | ||
| 83 | RELB | 1400048 | 17499 | -1.525 | -0.0181 | No | ||
| 84 | CDC25B | 6940102 | 17519 | -1.538 | 0.0051 | No | ||
| 85 | ARRB2 | 2060441 | 18568 | -3.434 | 0.0026 | No |

